Posts
Simple Perlin Noise Map
An interactive p5.js sketch that generates 2D terrain using Perlin noise, with different colors representing water, sand, and grass based on elevation values.
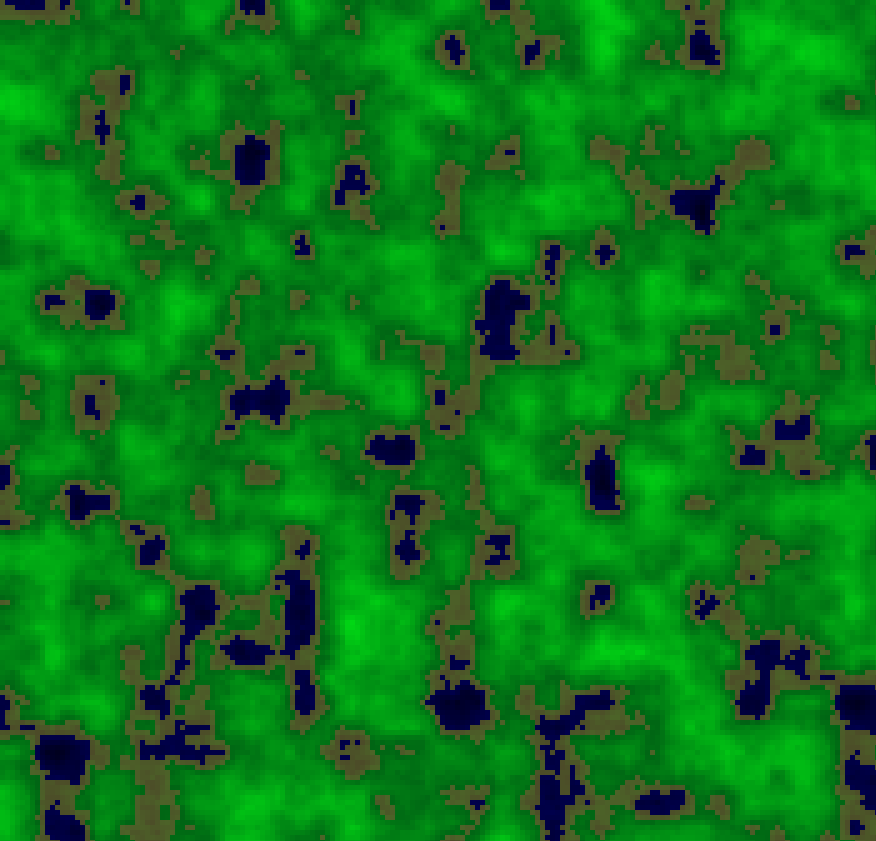
This sketch maps perlin noise between a value of 0 and 255 across a grid. Values greater than or equal to 100 are “grass”, values between 75 and 100 are “sand”, and values less than or equal to 75 are “water”.