Posts
Python NetworkX Library for Network Graph Visualization
A comprehensive guide to creating visually appealing network graphs with Python’s networkx library, including node positioning, custom coloring, edge labeling, and group visualization with ellipses.
Environment Setup
I ran into an issue when running pip install networkx. I had to CD to the path where I had Python installed. To find out where Python is installed, use:
where Python
and the output should resemble:
C:\Users\<you>\AppData\Local\anaconda3\python.exe
C:\Users\<you>\AppData\Local\Programs\Python\Python311\python.exe
C:\Users\<you>\AppData\Local\Microsoft\WindowsApps\python.exe
followed by:
cd C:\Users\<you>\AppData\Local\Programs\Python\Python311\python.exe
pip install networkx
Python Script
import json
import networkx as nx
import matplotlib.pyplot as plt
import numpy as np
from matplotlib.patches import Ellipse

# Load the JSON data
with open("dummy-data.json", "r") as file:
    data = json.load(file)

# Create a graph
G = nx.DiGraph()

# Add nodes and edges to the graph from the JSON data
node_colors = {}
group_nodes = {}  # {group: [node1, node2, ...]}
for group, details in data["groups"].items():
    if group not in group_nodes:
        group_nodes[group] = []
    for edge in details["edges"]:
        G.add_edge(edge["source"], edge["target"], color=details["color"], label=edge["label"])
        node_colors[edge["source"]] = details["color"]
        group_nodes[group].append(edge["source"])
        group_nodes[group].append(edge["target"])

# Compute node positions
width, height = 2, 2
pos = {}
center_node = "source-node"
pos[center_node] = (width / 2, height / 2)
node_colors[center_node] = "#8888FF"

# Positioning nodes around a circle
shell_nodes = [node for node in G.nodes() if node != center_node]
angle_step = 2 * np.pi / len(shell_nodes)
for index, node in enumerate(shell_nodes):
    angle = index * angle_step
    pos[node] = (width/2 + 0.75*np.cos(angle), height/2 + 0.75*np.sin(angle))

# Set DPI for the desired resolution
dpi = 256
fig, ax = plt.subplots(figsize=(24, 24), dpi=dpi)

# Legend proxy artists
from matplotlib.patches import Patch
legend_handles = [
    Patch(facecolor='#FF8888', edgecolor='black', label='group-01'),
    Patch(facecolor='#88FF88', edgecolor='black', label='group-02')
]

colors = [node_colors[node] for node in G.nodes()]
nx.draw_networkx_nodes(G, pos, node_color=colors, node_size=20000, ax=ax)
nx.draw_networkx_labels(G, pos, ax=ax, font_size=14)

for edge in G.edges(data=True):
    nx.draw_networkx_edges(G, pos, edgelist=[(edge[0], edge[1])], ax=ax, edge_color=edge[2]["color"], width=2)

edge_labels = nx.get_edge_attributes(G, 'label')
nx.draw_networkx_edge_labels(G, pos, edge_labels=edge_labels, font_size=14)

# Draw ellipses around groups of nodes
for group, nodes in group_nodes.items():
    unique_nodes = list(set(nodes))
    coords = [pos[node] for node in unique_nodes]
    x_coords, y_coords = zip(*coords)
    center = np.mean(x_coords), np.mean(y_coords)
    distances = [np.sqrt((x - center[0])**2 + (y - center[1])**2) for x, y in coords]
    max_distance = max(distances)
    ellipse = Ellipse(center, 2*max_distance, 2*max_distance, fill=False, edgecolor=node_colors[unique_nodes[0]], linestyle="--")
    ax.add_patch(ellipse)

# Adding the legend to the plot
ax.legend(handles=legend_handles, loc='upper right')

plt.axis("off")
plt.tight_layout()
plt.savefig("graph.png", format="png")
plt.show()
JSON Schema
{
    "nodes": [],
    "groups": {
        "group-01": {
            "color": "#FF8888",
            "edges": [
                {
                    "source": "group-01-node-01",
                    "target": "source-node",
                    "label": "label"
                },
                {
                    "source": "group-02-node-02",
                    "target": "source-node",
                    "label": "label"
                },
                {
                    "source": "group-03-node-03",
                    "target": "source-node",
                    "label": "label"
                },
                {
                    "source": "group-03-node-04",
                    "target": "source-node",
                    "label": "label"
                },
                {
                    "source": "group-04-node-05",
                    "target": "source-node",
                    "label": "label"
                },
                {
                    "source": "group-05-node-06",
                    "target": "source-node",
                    "label": "label"
                },
                {
                    "source": "group-06-node-07",
                    "target": "source-node",
                    "label": "label"
                },
                {
                    "source": "group-07-node-08",
                    "target": "source-node",
                    "label": "label"
                }
            ]
        },
        "group 02": {
            "color": "#88FF88",
            "edges": [
                {
                    "source": "group-02-node-01",
                    "target": "source-node",
                    "label": "label"
                },
                {
                    "source": "group-02-node-02",
                    "target": "source-node",
                    "label": "label"
                },
                {
                    "source": "group-02-node-03",
                    "target": "source-node",
                    "label": "label"
                },
                {
                    "source": "group-02-node-04",
                    "target": "source-node",
                    "label": "label"
                },
                {
                    "source": "group-02-node-05",
                    "target": "source-node",
                    "label": "label"
                }
            ]
        }
    }
}
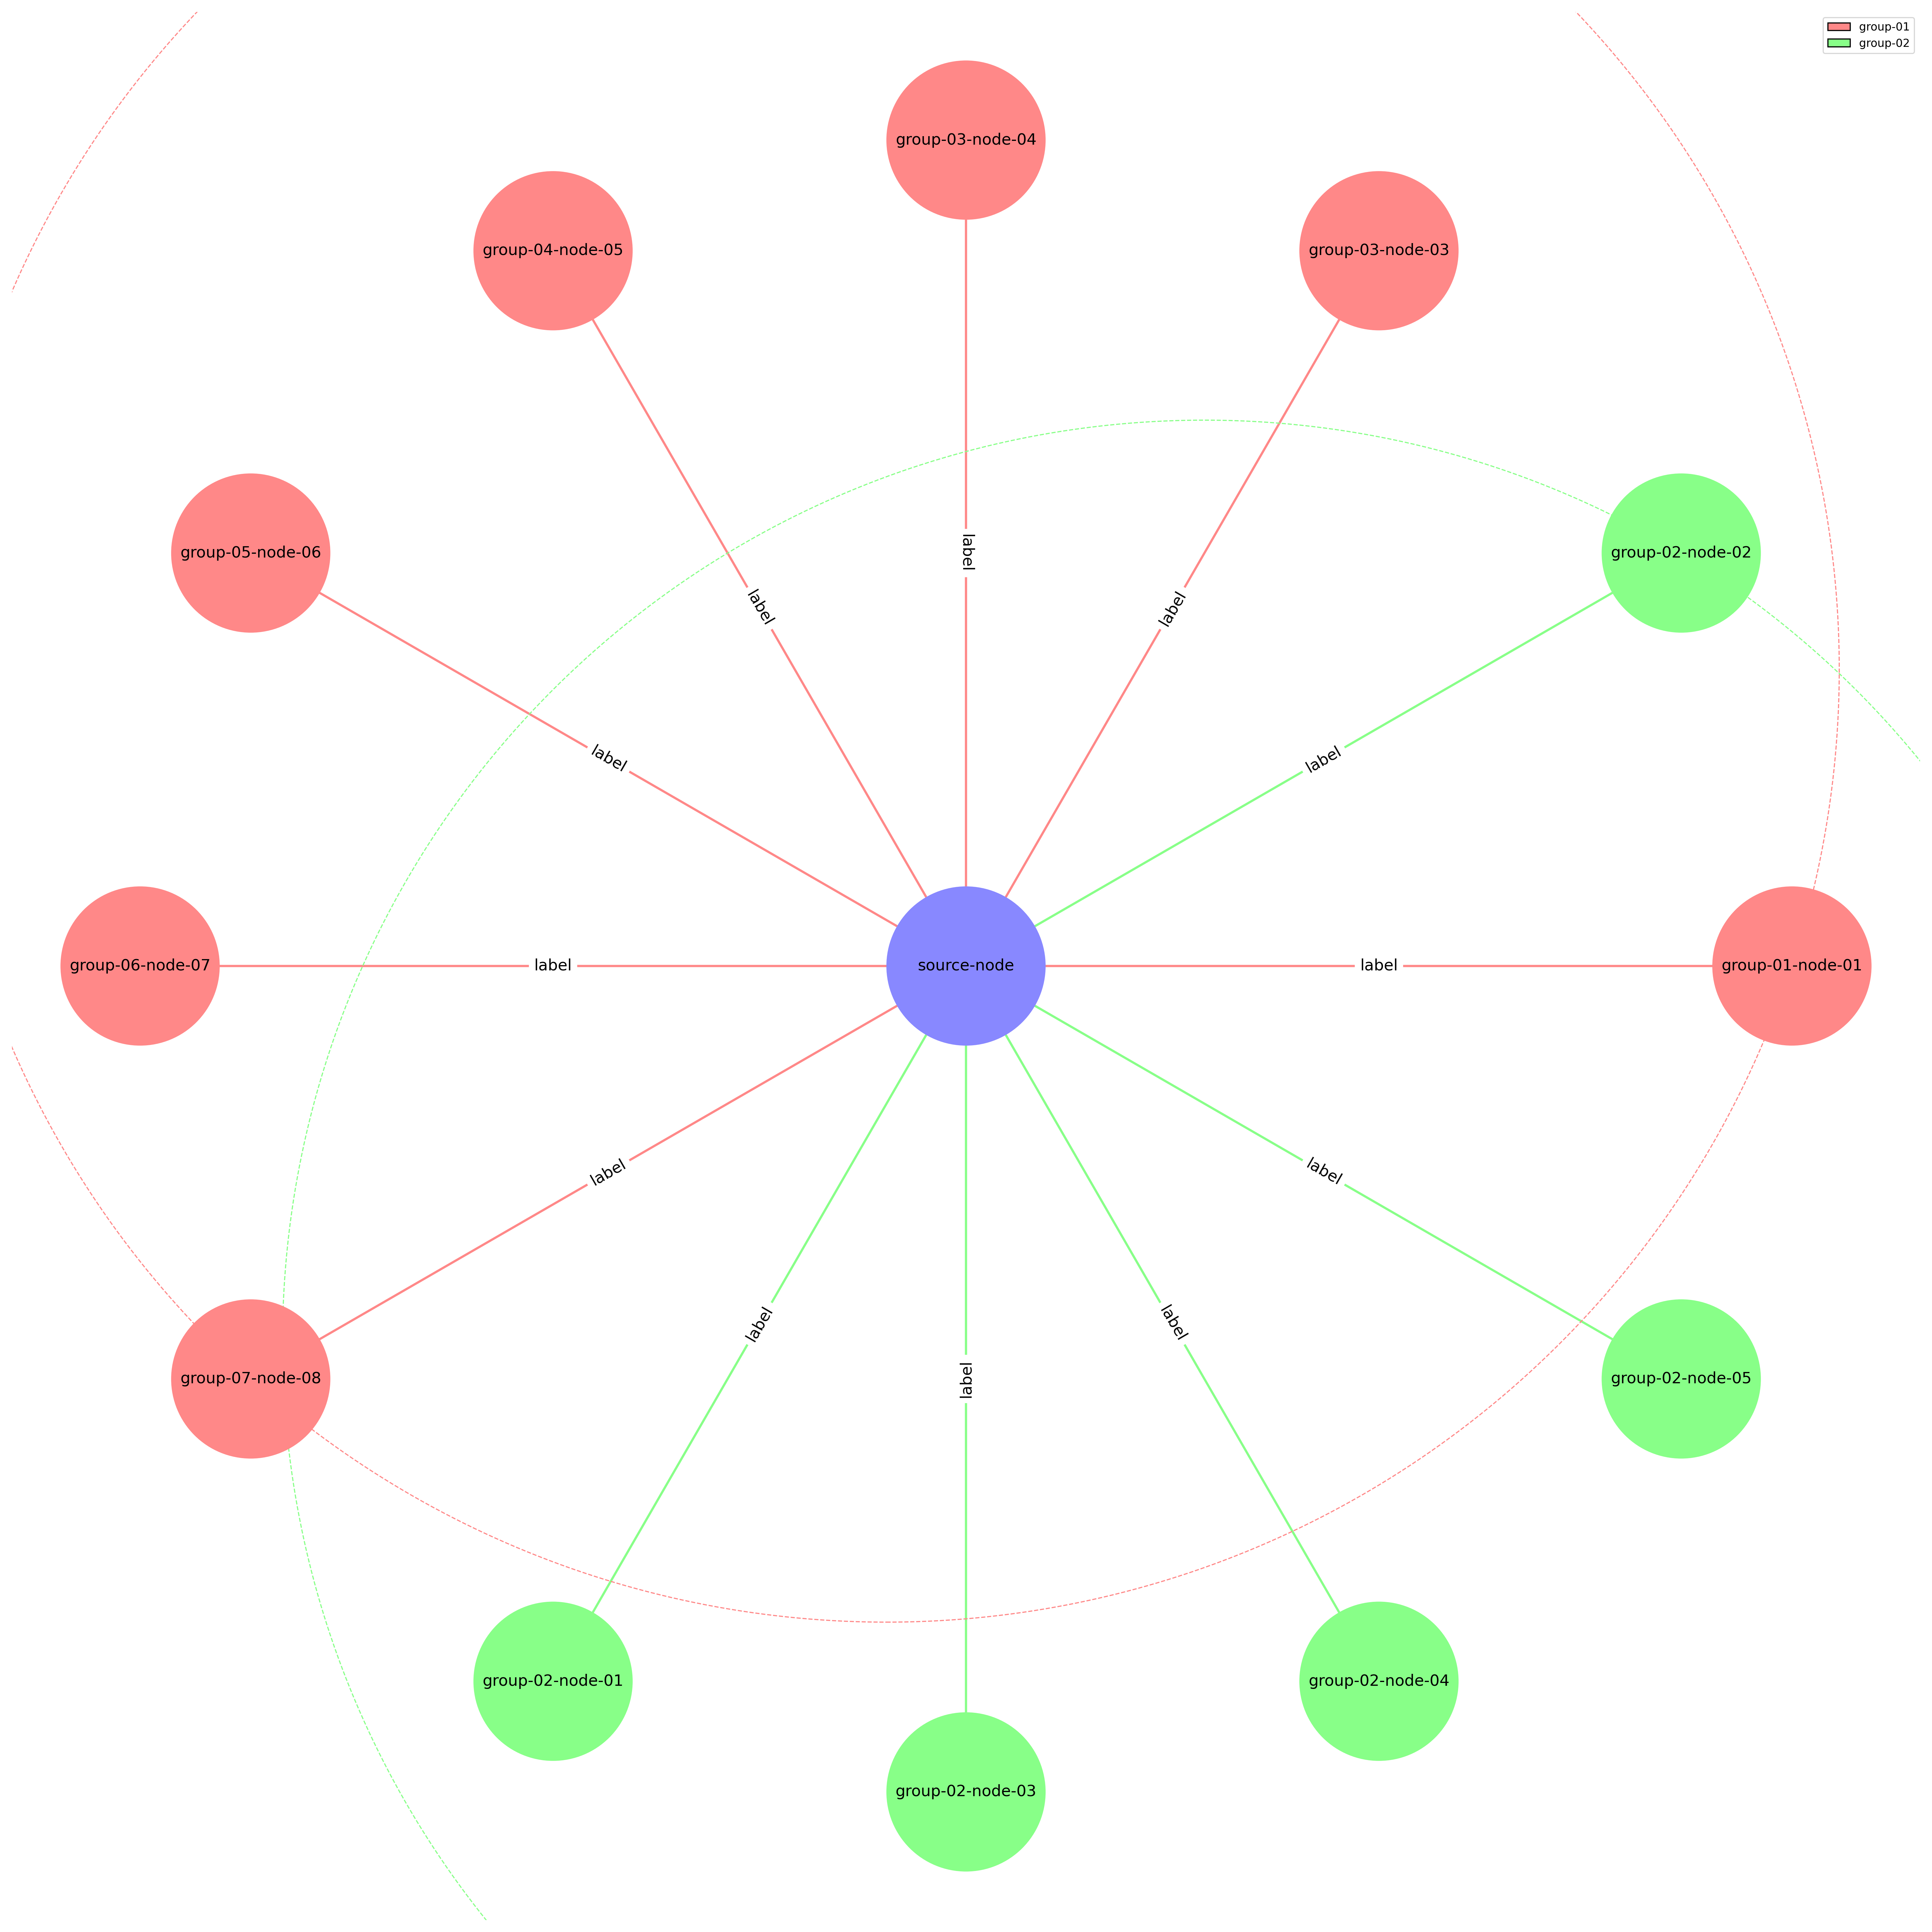
Graph Output