Visualizing and Analyzing Windows Folder Permissions
A comprehensive guide to exporting and visualizing Windows folder permissions using PowerShell and Python, including treemap visualizations of user access rights.

Term Archive
Entries connected to "Data-Visualization", gathered in one place for quick browsing.
A comprehensive guide to exporting and visualizing Windows folder permissions using PowerShell and Python, including treemap visualizations of user access rights.
A guide to visualizing Windows directory structures using Python and pyvis for interactive network graphs.

A guide to visualizing Local Area Network (LAN) topologies using Python and pyvis for interactive network graphs.

An experimental approach to extracting structured knowledge graphs from literary text using Mistral-7B LLM, demonstrated with the opening passage of The Hobbit and visualized as connected node-edge relationships.

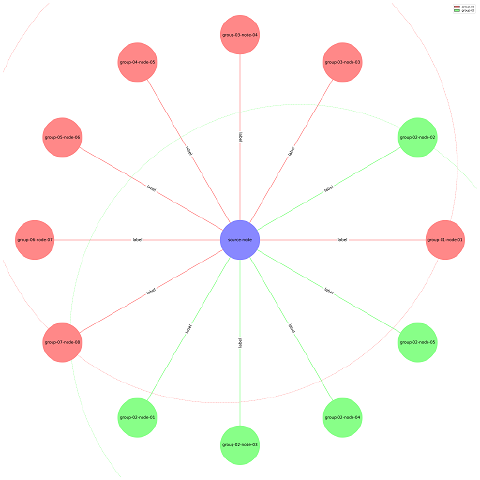
A comprehensive guide to creating visually appealing network graphs with Python’s networkx library, including node positioning, custom coloring, edge labeling, and group visualization with ellipses.
More to Browse
Relationship Map
Use the relationship map to follow related categories, tags, and entries beyond the current list.
Matching entries