k-means Clustering
A Processing visualization of the k-means clustering algorithm, demonstrating iterative centroid-based data partitioning and Voronoi cell formation for different values of k.
Term Archive
Entries connected to "Visualization", gathered in one place for quick browsing.
A Processing visualization of the k-means clustering algorithm, demonstrating iterative centroid-based data partitioning and Voronoi cell formation for different values of k.
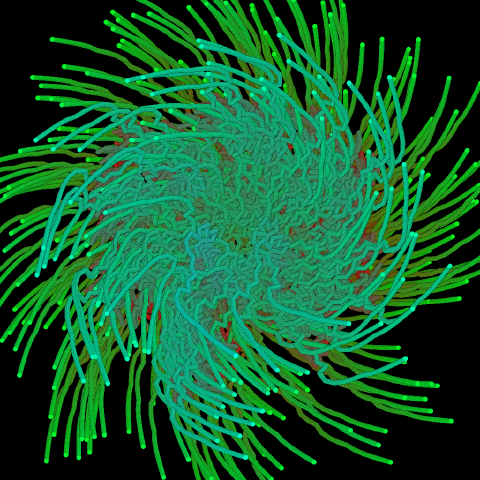
A Processing visualization of the Collatz Conjecture mapped onto a unit circle, creating 360 distinct branches with 1-degree turns, featuring an interactive exploration of number paths.
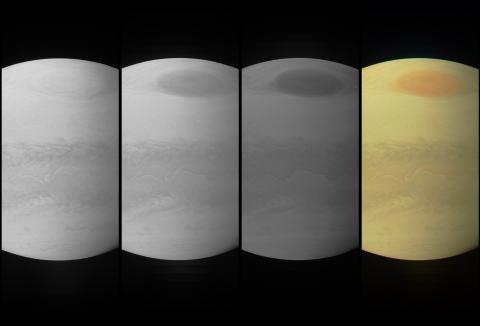
A Java program that reconstructs and processes raw image data from NASA’s Juno spacecraft’s pushframe camera, combining multiple filter strips to create high-resolution composite images of Jupiter.
More to Browse
Relationship Map
Use the relationship map to follow related categories, tags, and entries beyond the current list.
Matching entries