k-means Clustering
A Processing visualization of the k-means clustering algorithm, demonstrating iterative centroid-based data partitioning and Voronoi cell formation for different values of k.
Tag Archive
Entries connected to "Visualization", gathered in one place for quick browsing.
Collection filter
Narrow the entries already loaded here by title, summary, category, or tag.
A Processing visualization of the k-means clustering algorithm, demonstrating iterative centroid-based data partitioning and Voronoi cell formation for different values of k.
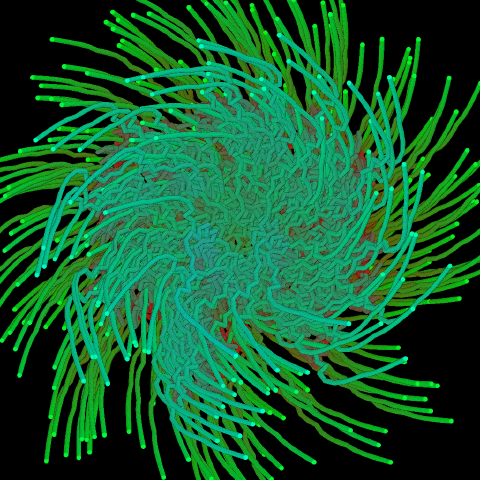
A Processing visualization of the Collatz Conjecture mapped onto a unit circle, creating 360 distinct branches with 1-degree turns, featuring an interactive exploration of number paths.
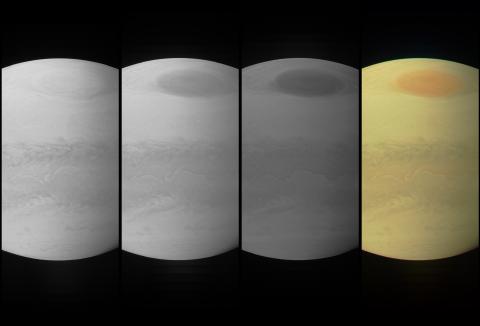
A Java program that reconstructs and processes raw image data from NASA's Juno spacecraft's pushframe camera, combining multiple filter strips to create high-resolution composite images of Jupiter.